Ticketing System
Overview
The Ticketing System helps users track issues identified in survey responses. Whenever a problem or follow-up action is required, a ticket can be created. Tickets act as a communication channel between team members and ensure timely resolution.
Where Tickets Can Be Created :
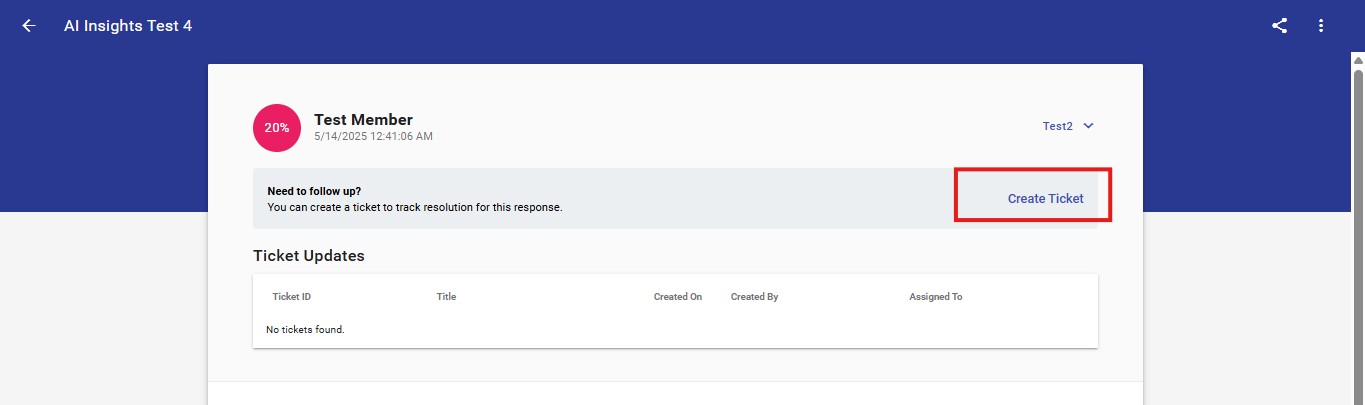
1. Survey Response Page
A ticket can be created from the Survey Response page when a user identifies an issue while reviewing a response.
2. Comments Section
Users can also generate a ticket directly from the Comments section if a comment requires escalation or action.

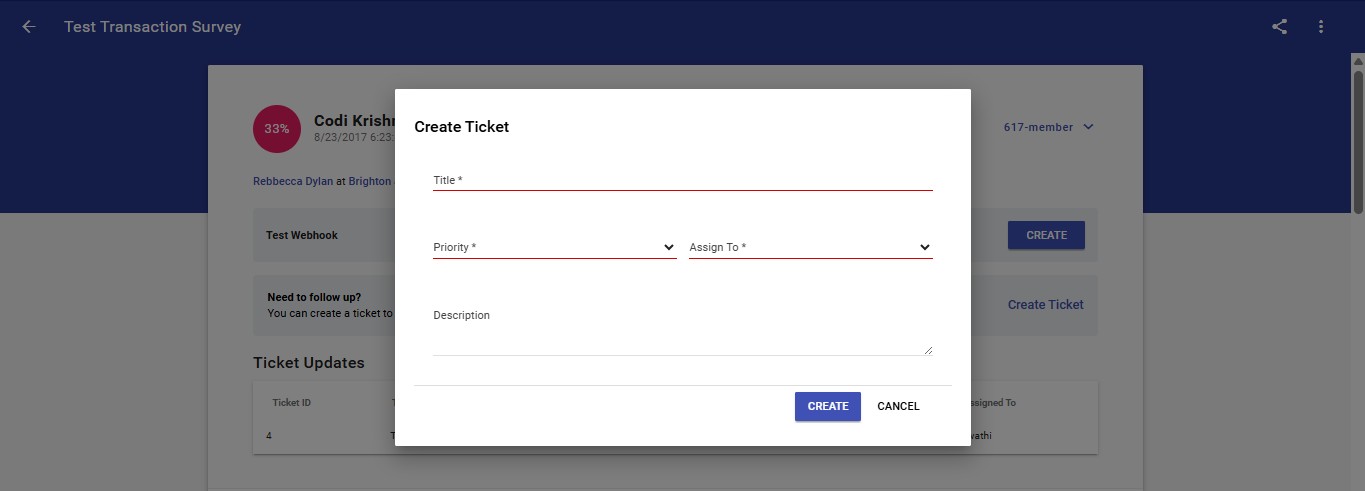
Creating a Ticket
When creating a ticket, the following fields must be filled:
- Title - A short summary describing the issue.
- Priority - Indicates urgency (Low, Medium, High, Critical).
- Assign To - The person responsible for resolving the ticket.
- Description - A detailed explanation with context.
Ticket Management Page
The Ticket Management Page shows complete information about the ticket and allows users to manage it.
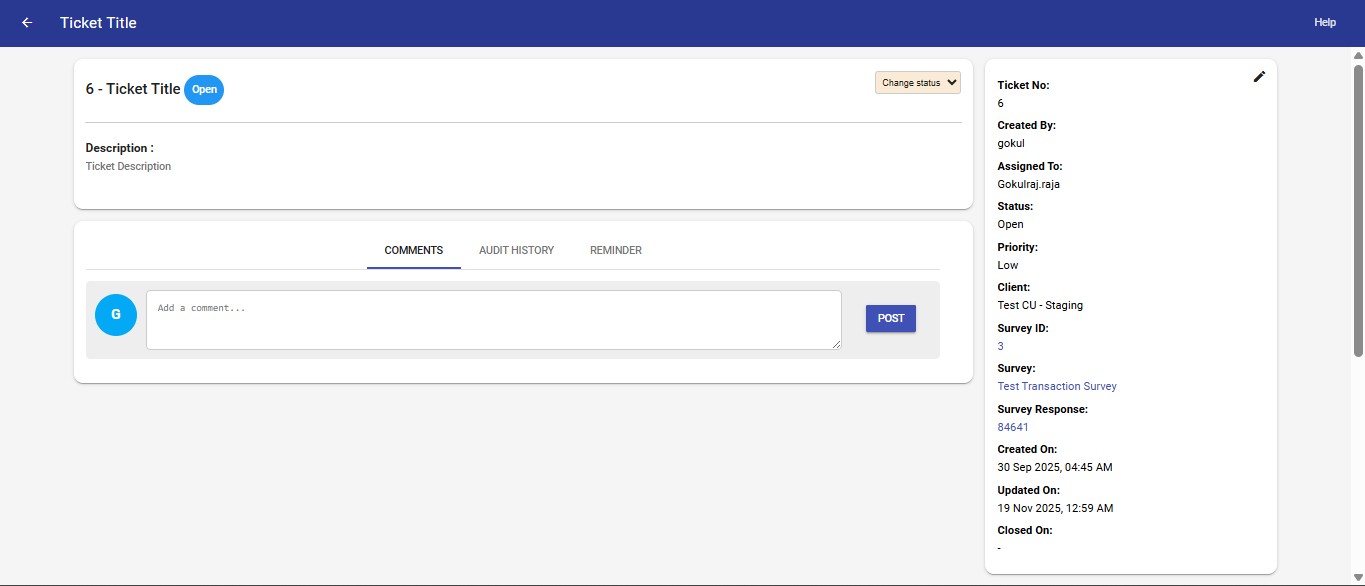
Ticket Details Include:
- Ticket No
- Created By
- Assigned To
- Status (Open, In Progress, Resolved, Closed)
- Priority
- Client
- Survey ID
- Survey Name
- Survey Response ID
- Created On
- Updated On
- Closed On
Member Information
Each ticket displays the member's details related to the survey response:
- Member Key
- Mobile Phone
- Date of Birth
- Account Number
Comments
Users can add comments to communicate updates, discuss issues, or provide clarifications.
- Helps track discussions
- Keeps context within the ticket
- Supports collaboration among team members
Ticket Status Validation
- Tickets cannot be marked as Resolved or Closed unless at least one comment is added.
Audit History
The Audit History logs all actions performed on a ticket:
- Ticket created
- Status changes
- Priority updates
- Assignment changes
- Other modifications
This ensures transparency and traceability.
Reminder System
The Reminder feature sends notifications to:
- The creator of the ticket
- The assigned user
This ensures the ticket receives timely attention and does not remain idle.
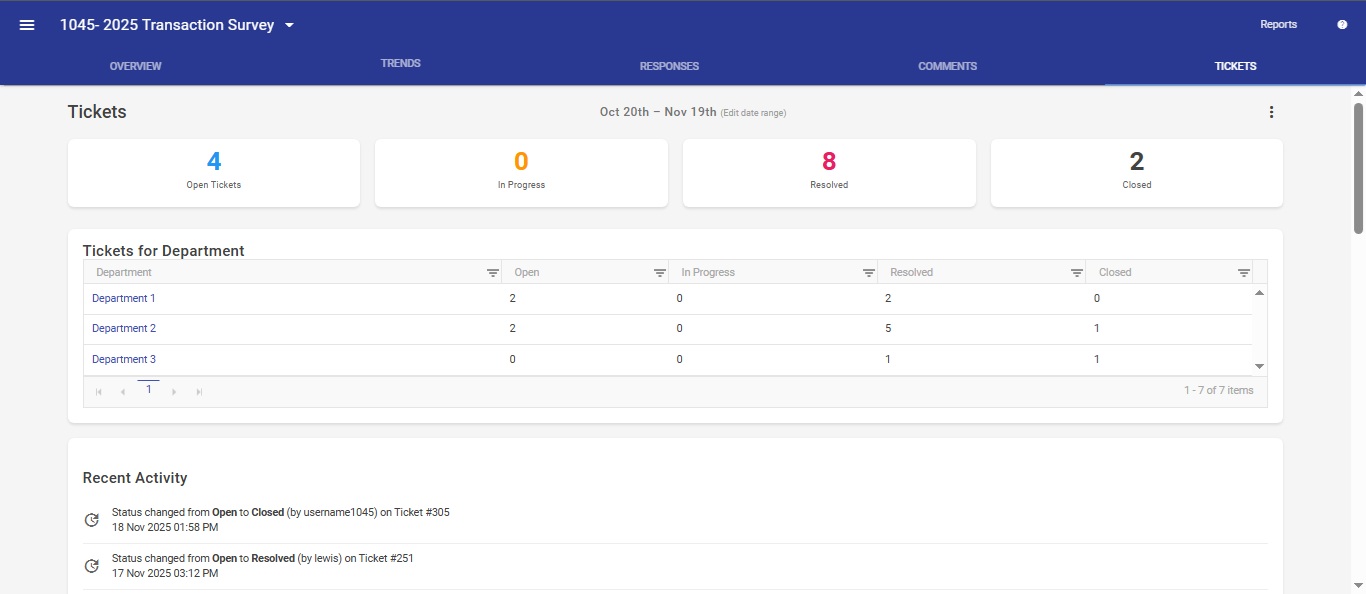
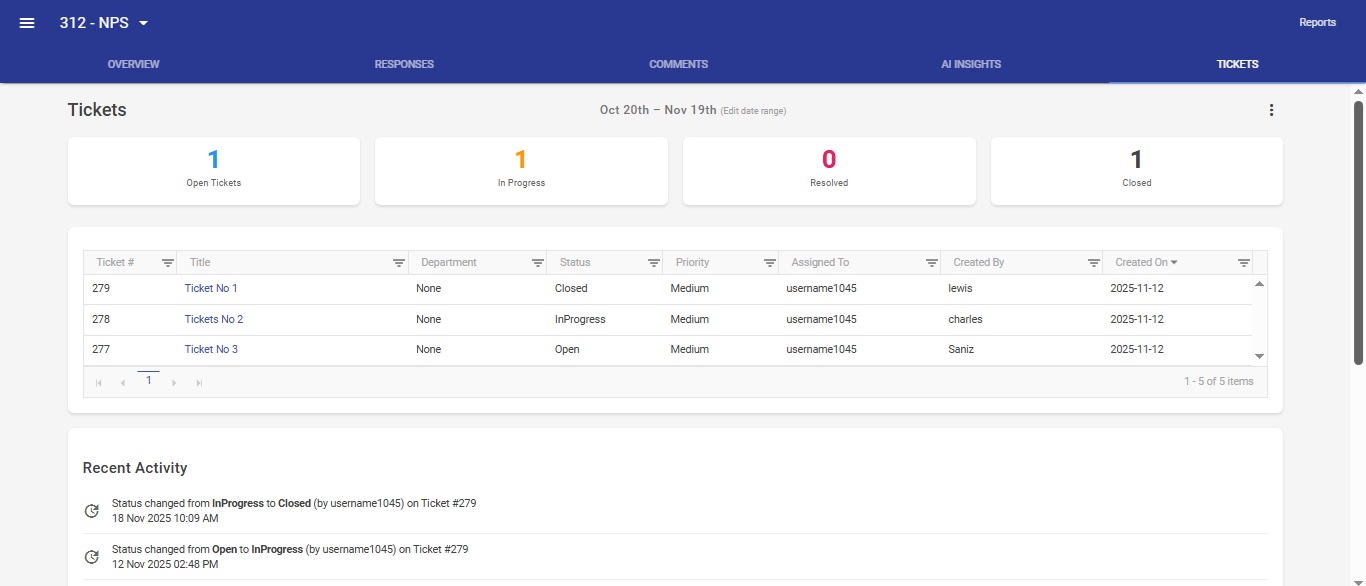
Ticketing Dashboard ( Survey Level)
Overview The Ticketing Dashboard provides a complete view of all ticket activity for a selected survey. It helps users understand ticket workload, department performance, recent updates, and overall progress. The dashboard adjusts its presentation based on the survey type so users always see the most relevant information.
What the Dashboard Shows
The dashboard is organized into the following sections:
- Ticket Statistics
- Department Summary (if applicable)
- Dashboard Scenarios (how information is presented)
- Ticket List
- Recent Activity
- Date Range
- Export Options
Each section updates based on the selected survey, department, and date range.
Ticket Statistics
At the top, the dashboard displays four key ticket counts for the selected date range:
- Open Tickets
- In Progress Tickets
- Resolved Tickets
- Closed Tickets
- Cancelled Tickets
These numbers give users a quick overview of the current ticket situation.
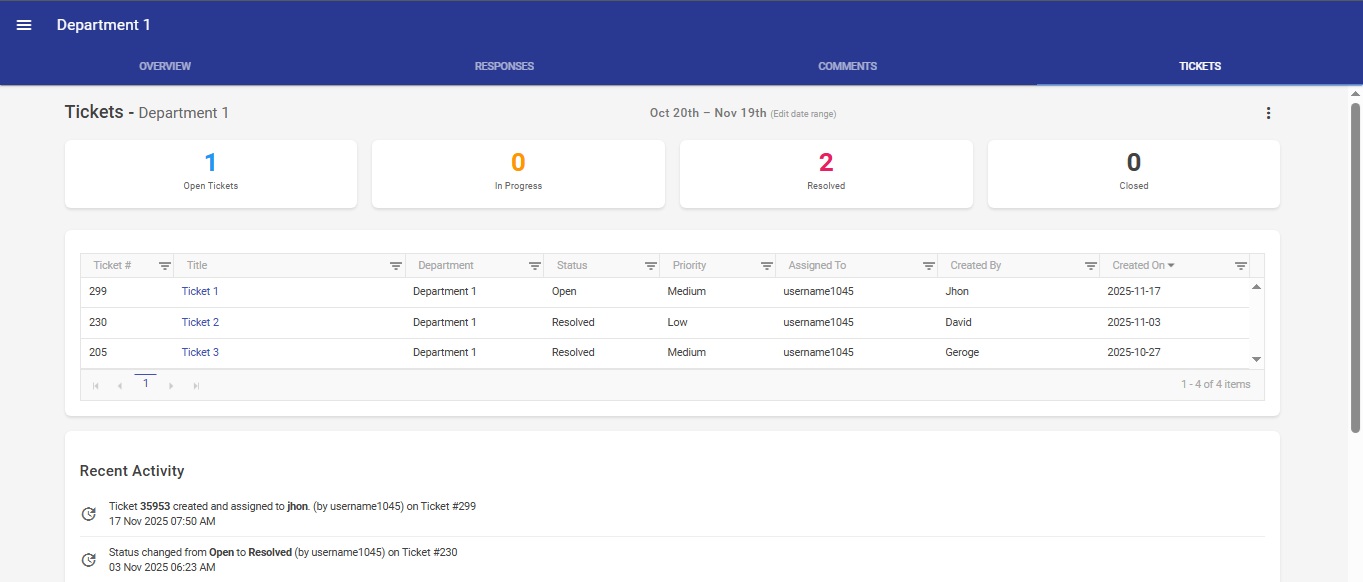
Department Summary (Transactional Surveys Only)
For surveys that involve multiple departments, the dashboard includes a Department Summary table that shows:
- Department Name
- Open ticket count
- In Progress ticket count
- Resolved ticket count
- Closed ticket count
Users can select a department to focus on the tickets for that specific area.
Dashboard Scenarios (How the Dashboard Presents Information):
The layout of the dashboard changes based on the type of survey and how the user enters the page. This ensures users always see the information most relevant to their context.
1. Transactional Survey (With Departments)
For surveys structured around departments:
- The dashboard presents a department-level overview.
- Each department has separate ticket counts.
- Users can pick a department to see tickets related to that area.
- Ticket statistics and recent activity reflect the chosen department.
This allows users to compare ticket activity across departments or drill down into a specific group.
2. Relationship Survey (No Departments)
For surveys that do not use departments:
- The dashboard provides a direct view of all tickets for the survey.
- Ticket statistics and recent activity represent the entire survey.
- No department breakdown is needed.
This gives a clean, simplified view where all tickets belong to one group.
3. Viewing a Specific Department
If the user opens the dashboard through a department-specific link:
- The dashboard focuses entirely on that department.
- Ticket statistics and recent activity apply only to that department.
- The user immediately sees the tickets relevant to that team.
This is ideal for managers or staff reviewing only their own department's performance.
Ticket List
The Ticket List provides a detailed view of individual tickets based on the chosen scenario (all tickets or department-specific tickets). It displays:
- Ticket Number
- Title (opens the ticket in a new tab)
- Department
- Status
- Priority
- Assigned To
- Created By
- Created On
The list supports sorting, filtering, and paging to make it easy to locate specific tickets.
Recent Activity
The Recent Activity panel shows the most recent updates made to tickets during the selected date range. Examples include:
- Status updates
- Comments added
- Ticket assignments
- Ticket creation or changes
Each entry shows:
- What happened
- Who performed the action
- Which ticket was involved
- Date and time
This helps users stay informed without opening each ticket individually.
Date Range
A date range appears at the top of the dashboard. Users can:
- View the currently applied date range
- Edit the range at any time
- See all statistics, tables, and activities update instantly based on the selected dates
This provides flexibility for reporting and analysis.
Export Options
Download as PDF Creates a PDF version of the dashboard, including:
- Ticket statistics
- Department or ticket table
- Recent activity
The layout is optimized for sharing and reporting.
Download as Excel Exports ticket data in spreadsheet form. This includes:
- All ticket details
- Member details
- Related department or survey information
This is ideal for deeper analysis, data reviews, or preparing reports.
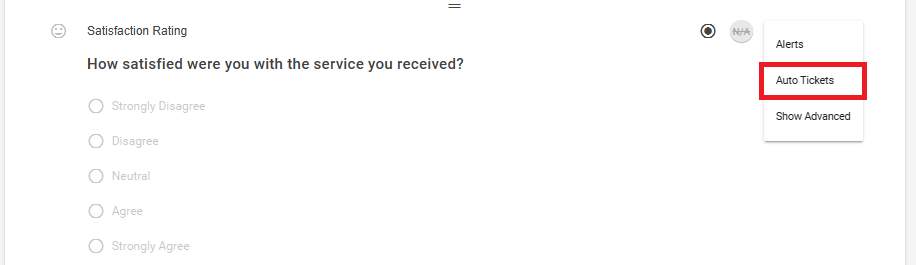
Auto Tickets
Overview
Auto Ticketing automatically creates tickets when predefined conditions are met during survey submission. This ensures that important feedback or follow-up actions are captured immediately without requiring manual intervention. Auto-created tickets follow the same lifecycle, validation, and audit rules as manually created tickets.
Auto Tickets are created only when Auto Ticketing is enabled at both the client level and the survey level. If disabled at either level, auto tickets will not be generated.
Configuring Auto Ticket Rules
-
Auto Ticket rules are created and managed by Admins or Managers in the Survey Builder.
-
Each rule allows users to define when and how a ticket should be created.
Creating an Auto Ticket Rule
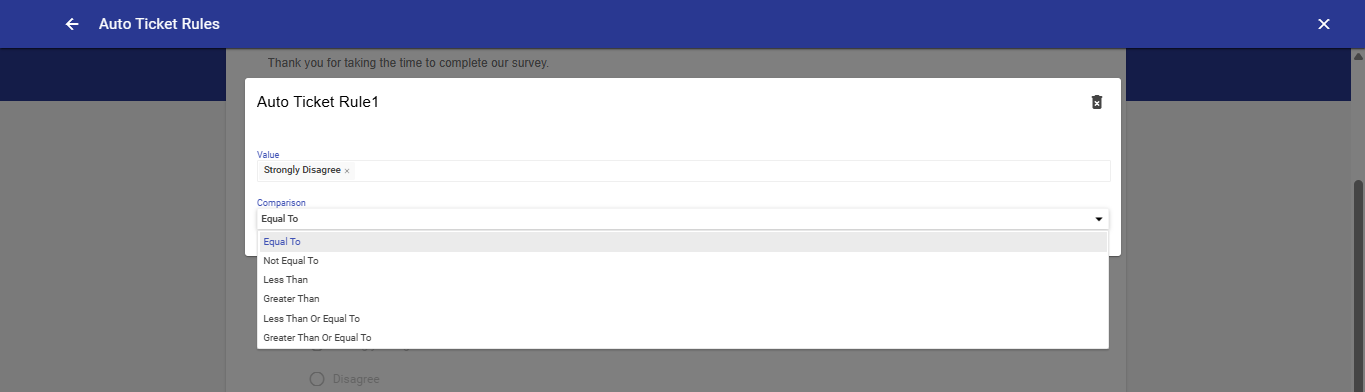
- While creating or editing an auto ticket rule, the following configurations are required:
Rule Name:
- A descriptive name used to identify the rule.
Trigger Conditions:
Trigger conditions determine when the rule fires and consist of:
Value:
The survey response value to be evaluated.
Comparison:
-
Specifies how the response value is compared. Supported options include Equal To, Not Equal To, Less Than, Greater Than, Less Than Or Equal To, and Greater Than Or Equal To.
-
A ticket is automatically created when the response satisfies the configured condition.
Ticket Manager Assignment (Invite File Dependency)
Auto ticket assignment relies on the TicketManagerEmail value provided in the Invite File.
The TicketManagerEmail column in the invite file determines who the auto-created ticket should be assigned to
-
Multiple email addresses can be provided, separated by comma, one eligible user will be selected for ticket assignment.
-
The system matches these emails against users within the same client who have LiveSurvey login access and have logged in within the last 30 days.
Note: If the TicketManagerEmail column is not provided in the invite file, auto ticket assignment falls back to system-defined defaults.
Ticket Assignment Logic
- When an auto ticket is created, the system first attempts to assign the ticket using the TicketManagerEmail provided in the invite file.
- If no eligible Ticket Manager exists, does not have LiveSurvey login access, or has not logged in within the last 30 days, the system falls back to an Admin user who has logged in within the last 30 days.
- If no eligible Admin is found, the system attempts to assign the ticket to a Super Admin.
- If no Super Admin exists for the client, the ticket is skipped and a warning is logged.
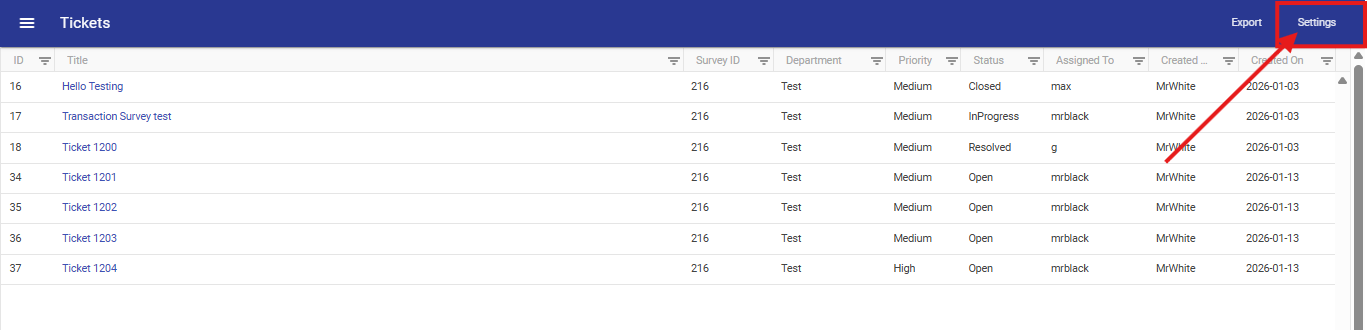
Ticket Settings
Overview
Ticket Settings define default configurations applied to both AutoTickets and manually created tickets, ensuring consistent ticket behavior across LiveSurvey.
These settings apply to newly created tickets only.
Available Settings
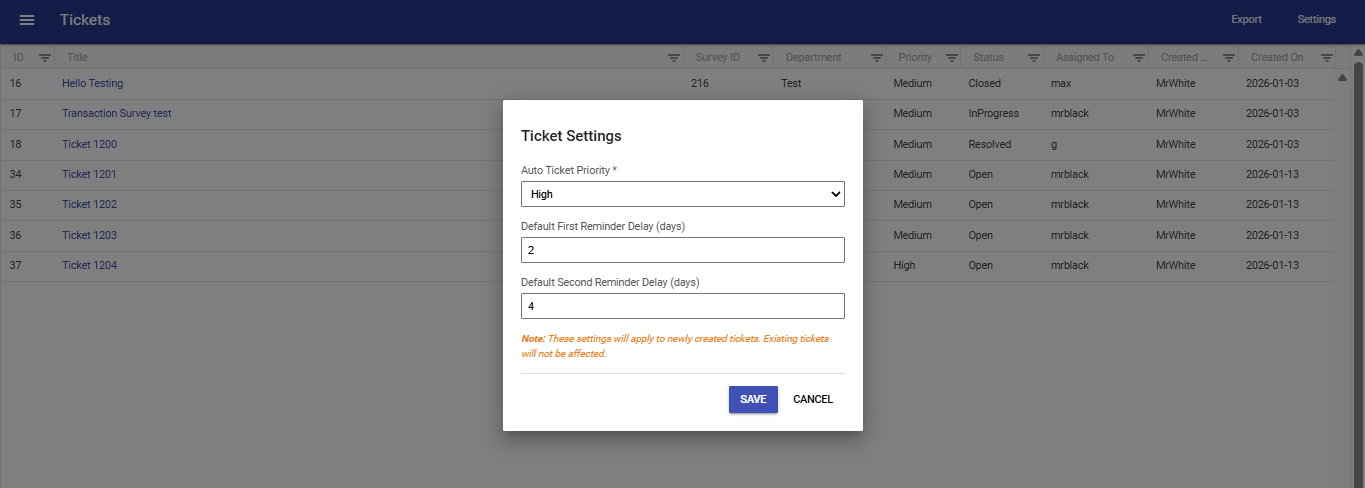
Default Ticket Priority : Sets the priority assigned to newly created tickets.
First Reminder Delay: Defines the number of days after ticket creation when the first reminder is triggered.
Second Reminder Delay: Defines the number of days after the first reminder when the second reminder is triggered.
Tickets Dashboard (Organisation Level)
Overview
The Tickets Dashboard provides a comprehensive, real-time view of all ticket activity across your organisation. It helps managers and staff monitor ticket workload, track resolution performance, identify overdue tickets, and analyse trends — all from a single page.
The dashboard updates dynamically based on the selected filters, department, employee, and date range. Every section reflects the most current data available.
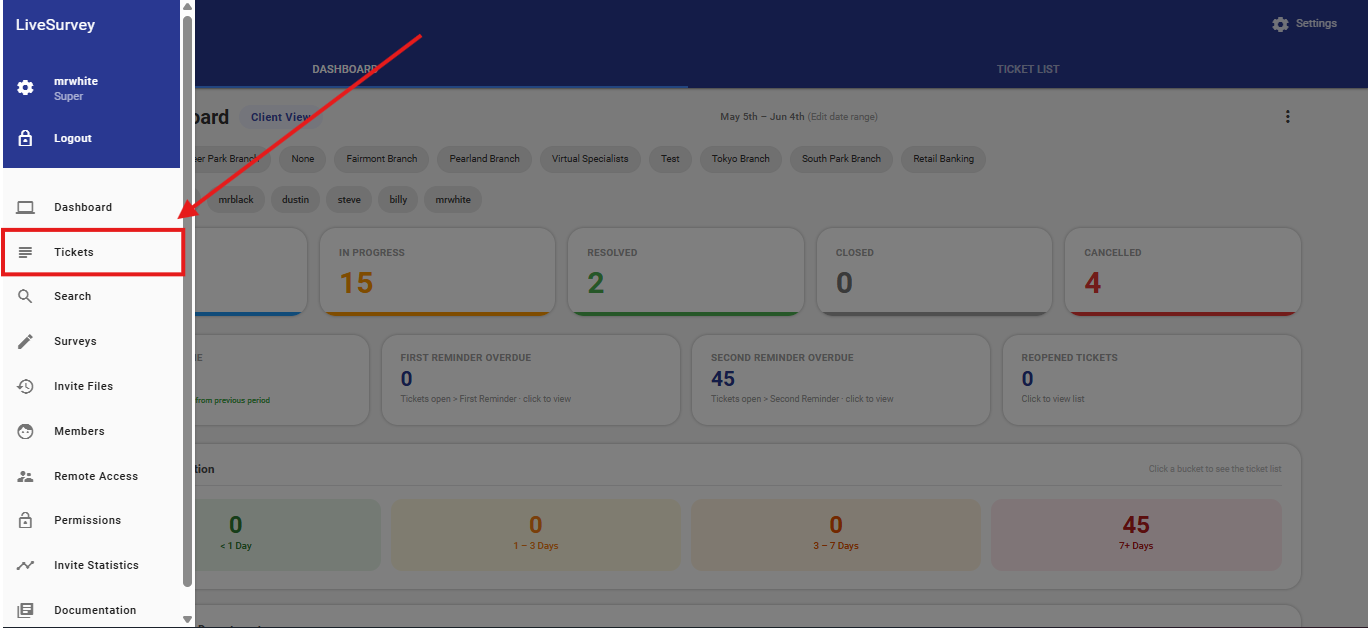
Accessing the Tickets Dashboard
The Ticket Dashboard is accessible from the main LiveSurvey navigation under the Tickets section for users with Manager or Admin access. Staff users do not have access to this dashboard.
Dashboard Header
The header appears at the top of every dashboard page and provides key context and controls.
- Ticket Dashboard Title — Identifies the current module.
- Scope Badge — Displays the current data scope, such as organisation View or a specific department name. Updates automatically when filters are applied.
- Date Range Display — Shows the active reporting period, for example Jan 01, 2025 – Jan 31, 2025.
- Edit Date Range — Click this link to change the reporting period. All panels refresh immediately.
- More Options Menu (⋮) — Located in the top-right corner. Click to access:
- Dashboard Preferences — Show or hide individual dashboard sections/cards.
- Download as PDF — Export the current dashboard view as a PDF file.
Department Filter Chips
A row of clickable chips appears below the header, allowing Managers and Admin users to filter the entire dashboard to a specific department.
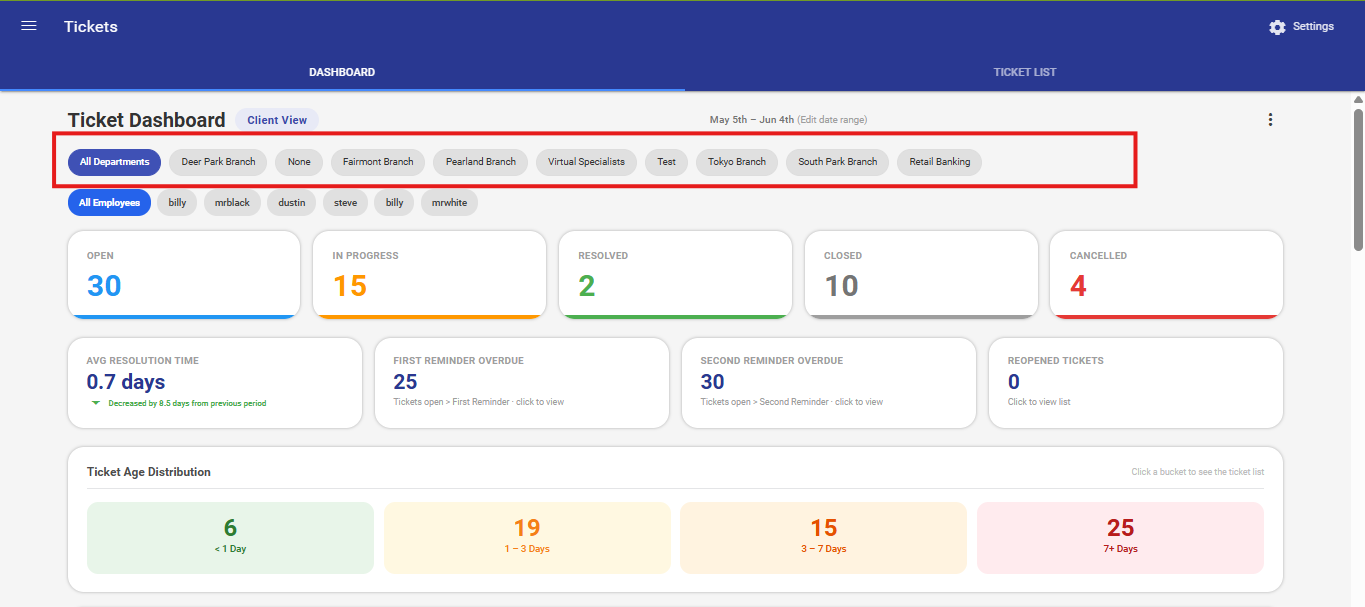
- All Departments — The default selection. Displays combined data across all departments.
- Individual Department Chips — One chip per department that has ticket activity. Clicking a chip filter every panel on the dashboard to that department only.
Behaviour when a department is selected:
- All stats cards, KPI cards, heatmap, priority chart, assignee workload, and top surveys refresh to show only the selected department's data.
- The Department Summary Table and Department Overview Chart are hidden — they are not relevant when already scoped to a single department.
- The Scope Badge updates to display the selected department name.
- To return to the full view, click All Departments.
Employee Filter Chips
A second row of chips allows Managers and Admin users to filter the dashboard by a specific team member (assignee).
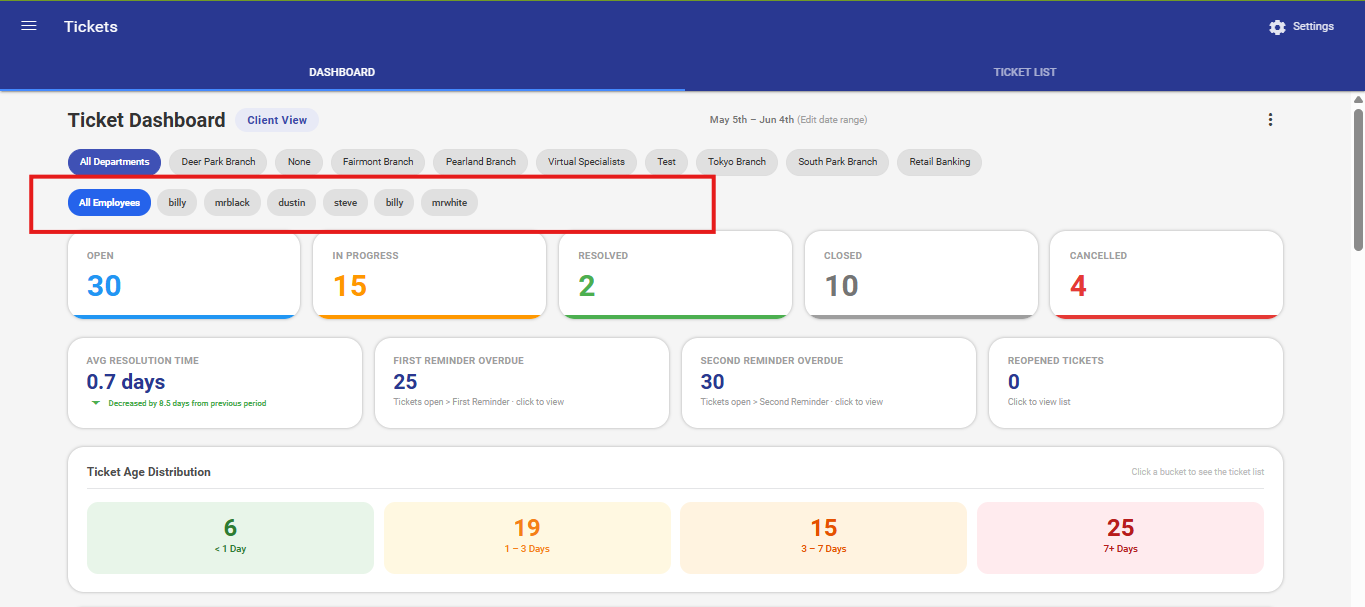
- All Employees — The default selection. Shows data across all assignees within the selected filters.
- Individual Employee Chips — One chip per assignee. Clicking a chip filters the dashboard to show only that person's tickets.
Behaviour when an employee is selected:
- Stats cards, KPI cards, heatmap, priority chart, and top surveys refresh to show only that assignee's tickets.
- The Department Summary Table, Department Overview Chart, and Assignee Workload panel are hidden.
- The Scope Badge updates to reflect both the department and assignee, for example Willamette Branch • Billy.
Combined Filtering:
Managers and Admin users can combine both filters.. For example, selecting a department and then an employee will show only that employee's tickets within the selected department.
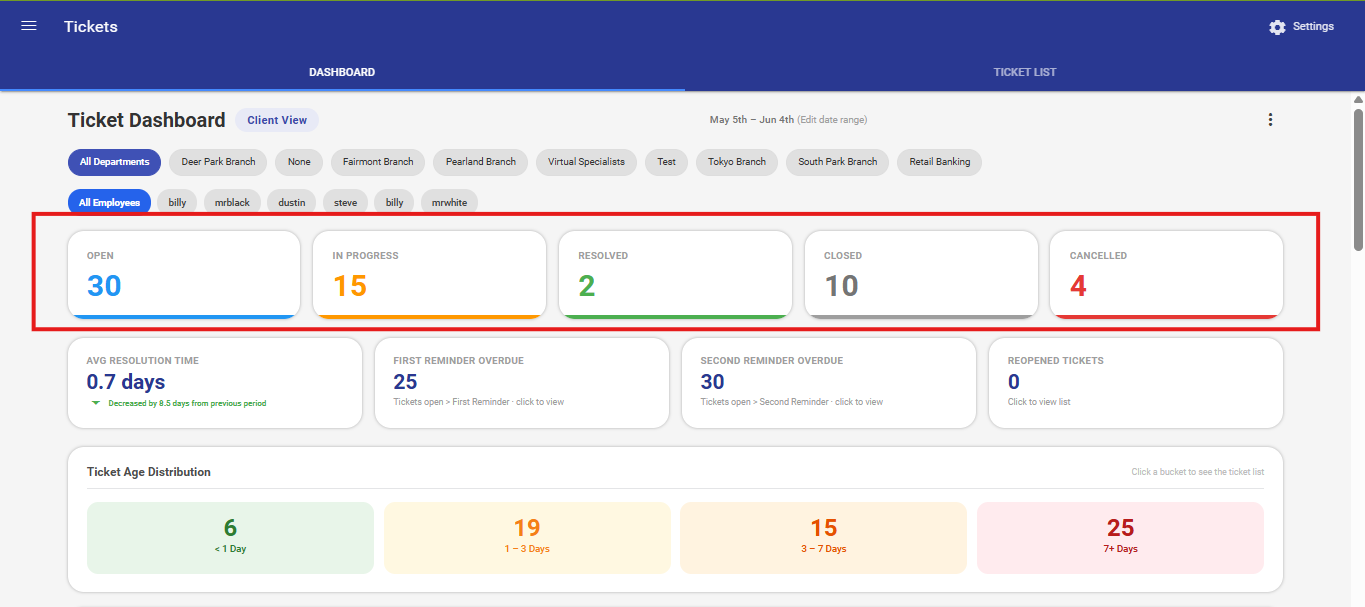
Stats Cards
Five cards appear near the top of the dashboard, displaying the total count of tickets in each lifecycle status for the selected date range and filters.
| Card | Colour | What It Shows |
|---|---|---|
| Open | Blue | Tickets created but not yet assigned or worked on. |
| In Progress | Amber | Tickets actively being worked on by an assignee. |
| Resolved | Green | Tickets marked as resolved by the assignee. |
| Closed | Grey | Tickets formally closed — no further action required. |
| Cancelled | Red | Tickets that were cancelled before resolution and require no further action. |
- Clicking any card opens a drill-down panel listing the individual tickets behind that count, including subject, assignee, department, priority, and status.
Note: Both resolved and closed tickets are treated as completed throughout the dashboard. Some credit unions use resolved as their terminal status; others use closed.
KPI Cards
Four KPI cards sit below the stats cards and measure the efficiency of ticket handling.
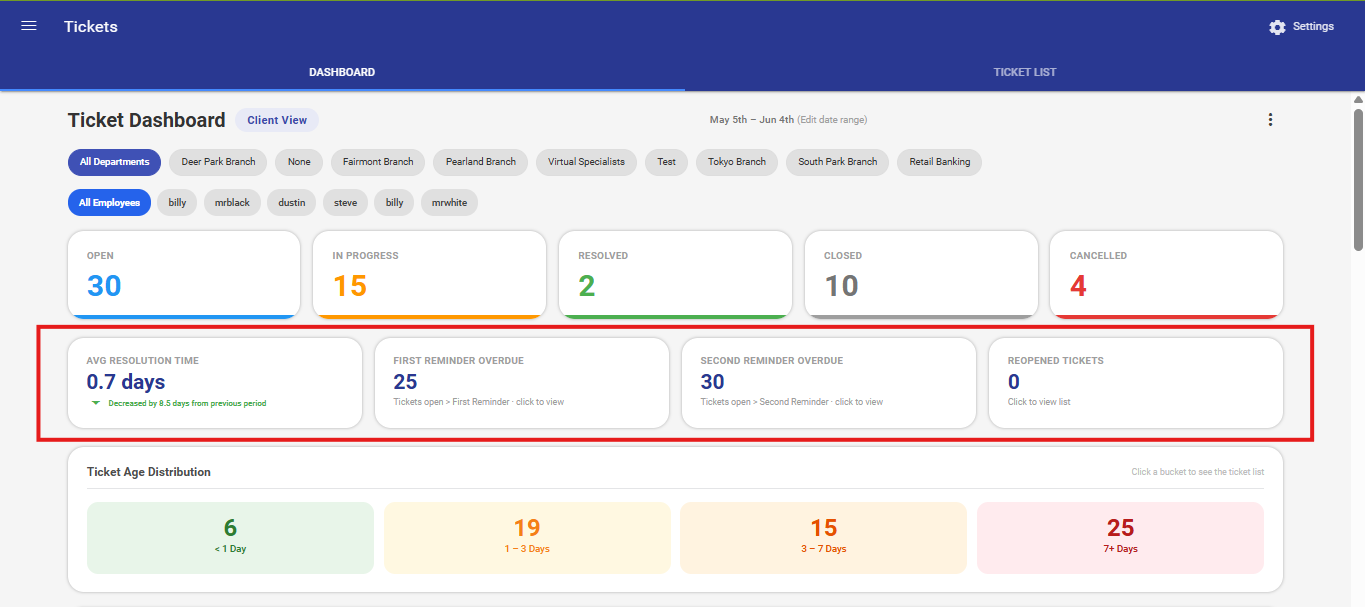
Average Resolution Time
- Displays the average number of days it took to resolve or close tickets within the selected period.
- A trend indicator (arrow and text) shows the change compared to the previous equivalent period:
- Arrow down (green) — Resolution time has improved; tickets are being resolved faster.
- Arrow up (red) — Resolution time has worsened; tickets are taking longer.
- The previous period is automatically calculated as an equal-length window before the selected date range.
First Reminder Overdue
- Displays the count of Open or In Progress tickets that have exceeded the configured First Reminder Delay threshold without being resolved.
- Click the card to open a drill-down listing all affected tickets.
- The reminder threshold is configured in Ticket Settings.
Second Reminder Overdue
- Displays the count of Open or In Progress tickets that have exceeded the configured Second Reminder Delay threshold — a more urgent escalation indicator.
- Click the card to open a drill-down listing all affected tickets.
- Tickets in this count require immediate attention and likely need manager escalation.
Reopened Tickets
- Displays the count of tickets that were Closed and subsequently reopened (moved back to Open) within the selected period.
- A high count may indicate tickets are being closed before the underlying issue is fully resolved.
- Click the card to view the list of reopened tickets.
Ticket Age Distribution
The Ticket Age Distribution panel shows how long currently active (Open and In Progress) tickets have been waiting without resolution.
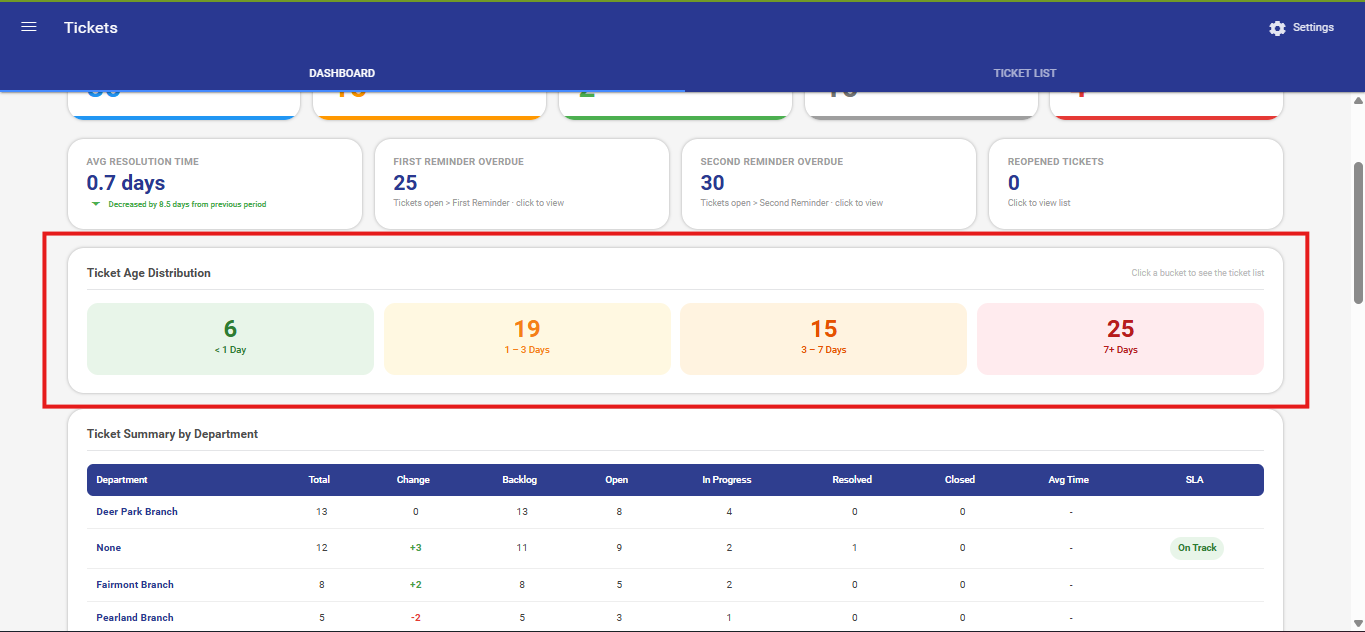
Tickets are grouped into four colour-coded age buckets:
| Bucket | Age Range | Colour | Meaning |
|---|---|---|---|
| < 1 Day | Less than 1 day | Green | Brand-new tickets — assign promptly. |
| 1 – 3 Days | 1 to 3 days | Yellow | Approaching the first reminder threshold — verify progress. |
| 3 – 7 Days | 3 to 7 days | Orange | First reminder likely overdue — follow up urgently. |
| 7+ Days | More than 7 days | Red | Well past the second reminder — escalate immediately. |
- Clicking any bucket opens a drill-down panel listing all tickets within that age group.
- Only Open and In Progress tickets are counted. Resolved and Closed tickets are excluded.
Ticket Summary by Department
The Ticket Summary by Department table provides a row-per-department breakdown of ticket volume, trend, backlog, status counts, average resolution time, and SLA health.
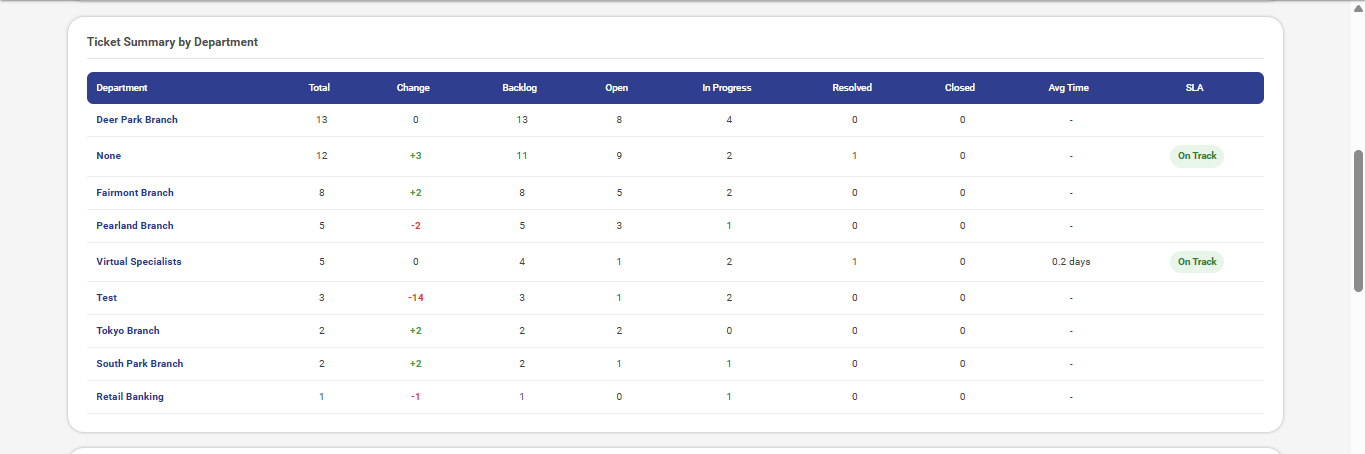
This table is only visible when the All Departments filter is active.
Columns:
| Column | Description |
|---|---|
| Department | Name of the department. Click to drill into that department's data. |
| Total | Total tickets created from this department in the selected period. |
| Change | Difference in ticket count compared to the previous equivalent period. |
| Backlog | Tickets still Open or In Progress — not yet resolved or closed. |
| Open | Count of tickets in Open status. |
| In Progress | Count of tickets in In Progress status. |
| Resolved | Count of tickets in Resolved status. |
| Closed | Count of tickets marked as Closed. |
| Avg Time | Average days from creation to resolution or closure. |
| SLA Status | Colour-coded badge indicating SLA compliance status. |
SLA Status Indicators:
| Status | Colour | Condition |
|---|---|---|
| On Track | Green | Average resolution time is below the warning threshold. |
| At Risk | Orange | Average resolution time is between the warning threshold and target. |
| Overdue | Red | Average resolution time exceeds the configured target. |
- Click any column header to sort the table by that column. Click again to reverse the sort order.
- Click a department name to drill into that department — the entire dashboard filters to show only that department's data.
Note: SLA thresholds are configured per Credit Union in Ticket Settings. Contact your Admin or Manager to review or adjust your targets.
Department Ticket Overview Chart
The Department Ticket Overview Chart presents a grouped bar chart comparing ticket activity across all departments for the selected date range.
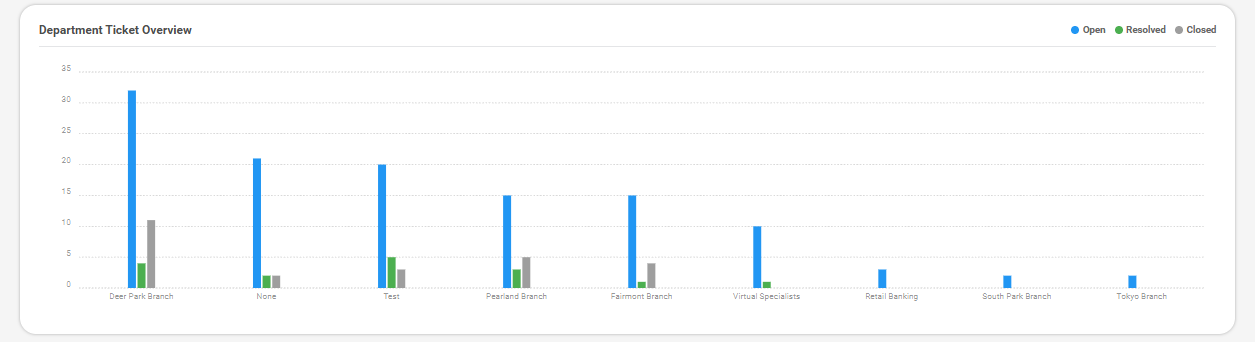
This chart is only visible when the All Departments filter is active.
Chart Series:
| Series | Colour | What It Represents |
|---|---|---|
| Created (Total) | Blue | Total tickets created from each department. |
| Resolved | Green | Tickets marked as Resolved per department. |
| Closed | Grey | Tickets formally Closed per department. |
- Hover over any bar to see a tooltip showing the department name and exact count.
- A large blue bar with small green and grey bars indicates a growing backlog in that department.
Tickets by Priority Chart
The Tickets by Priority chart displays a bar chart showing the distribution of tickets across priority levels within the current scope and date range.
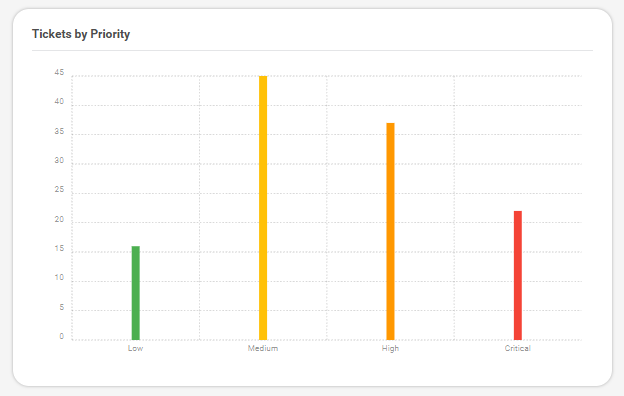
| Priority | Colour | Meaning |
|---|---|---|
| Low | Green | Minor issues — resolve during normal workflow. |
| Medium | Yellow | Moderate impact — schedule within standard SLA. |
| High | Orange | Significant impact — prioritise and resolve promptly. |
| Critical | Red | Immediate threat — escalate and resolve without delay. |
- If no ticket data is available for the current filters, a No data available message is displayed.
Assignee Workload
The Assignee Workload panel displays the current ticket load for each team member within the active scope and date range.
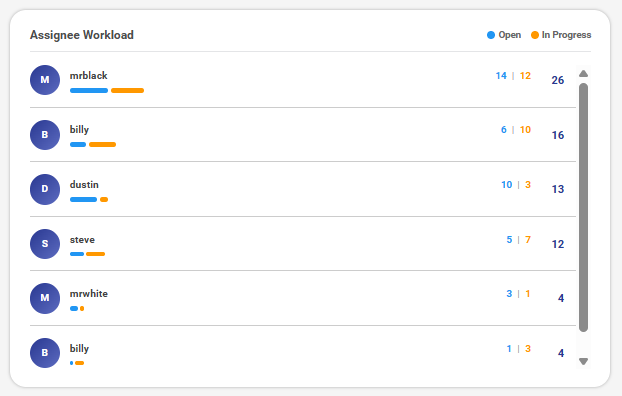
Each assignee entry displays:
- Avatar — Initials automatically generated from the assignee's name.
- Name — Full name of the team member.
- Open Count — Number of Open tickets assigned to this person (shown in blue).
- In Progress Count — Number of In Progress tickets assigned to this person (shown in orange).
- Workload Bars — Two colour-coded horizontal bars scaled relative to the highest workload assignee., providing a quick visual comparison across the team.
-
Total Count — Combined Open and In Progress count.
-
Clicking an assignee row activates the employee filter for that person. The dashboard refreshes to show only their tickets.
- To return to the full team view, click All Employees in the employee filter row.
- If no assignee data is available, a No data available for the selected filters message is shown.
Top Ticket Drivers (Surveys)
The Top Ticket Drivers panel lists the top 5 surveys that generated the most support tickets within the selected date range and filters.
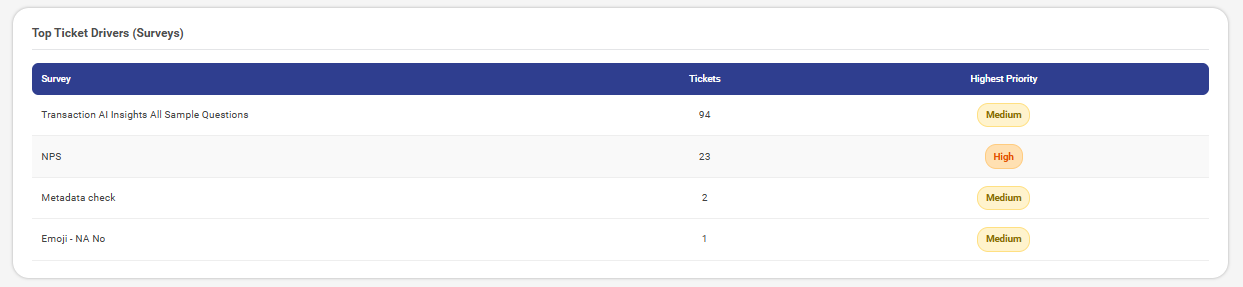
| Column | Description |
|---|---|
| Survey | The name of the survey. |
| Tickets | Total tickets generated from responses to this survey. |
| Highest Priority | A colour-coded badge showing the most common priority level among that survey's tickets. |
- If the same survey consistently appears at the top with Critical or High priority, it may indicate a systemic issue with the underlying process or service.
- If no data is available for the current filters, a No data available message is displayed.
Dashboard Preferences
Managers and Admin users can customise their dashboard view by showing or hiding individual sections. Preferences are saved to the user profile and persist across sessions.
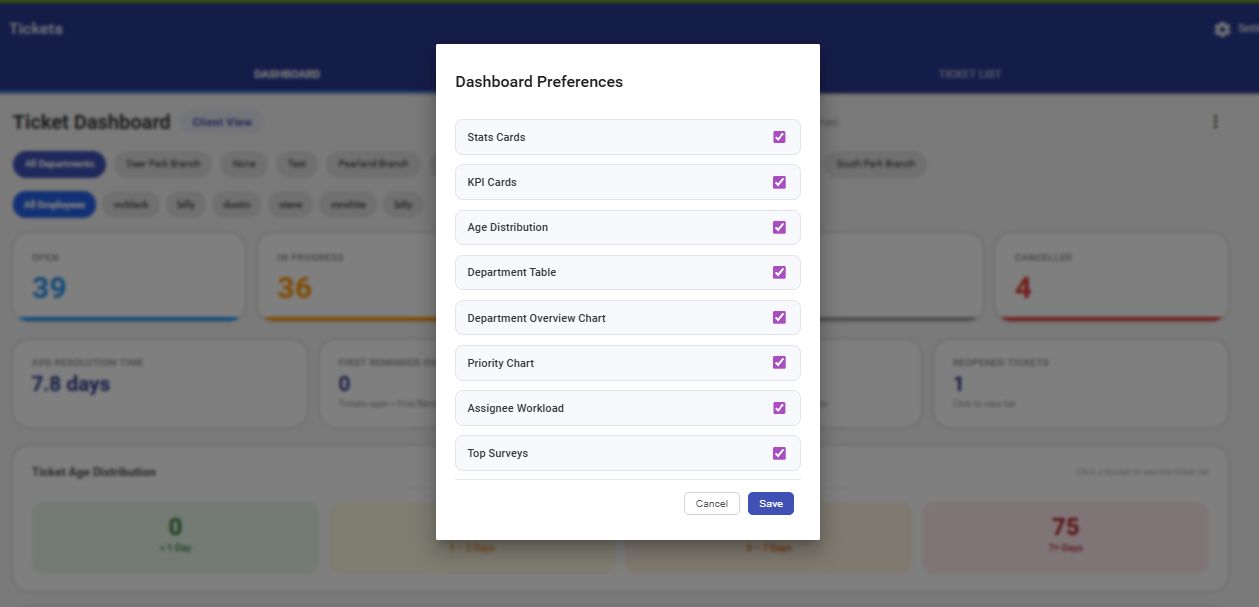
To open Dashboard Preferences: Click the More Options menu (⋮) in the dashboard header, then select Dashboard Preferences.
Available Preferences:
| Preference | Controls |
|---|---|
| Stats Cards | The four status count cards (Open, In Progress, Resolved, Closed). |
| KPI Cards | Average Resolution Time, Reminder Overdue counts, and Reopened Tickets. |
| Age Distribution | The Ticket Age Distribution heatmap. |
| Department Table | The sortable Ticket Summary by Department table. |
| Department Overview Chart | The grouped bar chart comparing departments. |
| Priority Chart | The Tickets by Priority bar chart. |
| Assignee Workload | The workload panel listing all assignees. |
| Top Surveys | The Top Ticket Drivers (Surveys) table. |
- Click Save to apply and save preferences. The dashboard refreshes immediately.
- Click Cancel to close the panel without making any changes.
Note: Preferences are personal — changing your settings does not affect other users' views.
Ticket Settings
Ticket Settings define the default thresholds that drive KPI calculations and SLA indicators throughout the dashboard. These settings apply to newly created tickets only.
Available Settings:
| Setting | Description |
|---|---|
| Auto Ticket Priority | The default priority assigned to newly created tickets. |
| Default First Reminder Delay (days) | Number of days after ticket creation when the first reminder is triggered. Tickets exceeding this threshold appear in the First Reminder Overdue KPI card. |
| Default Second Reminder Delay (days) | Number of days after the first reminder when the second reminder is triggered. Tickets exceeding this appear in the Second Reminder Overdue KPI card. |
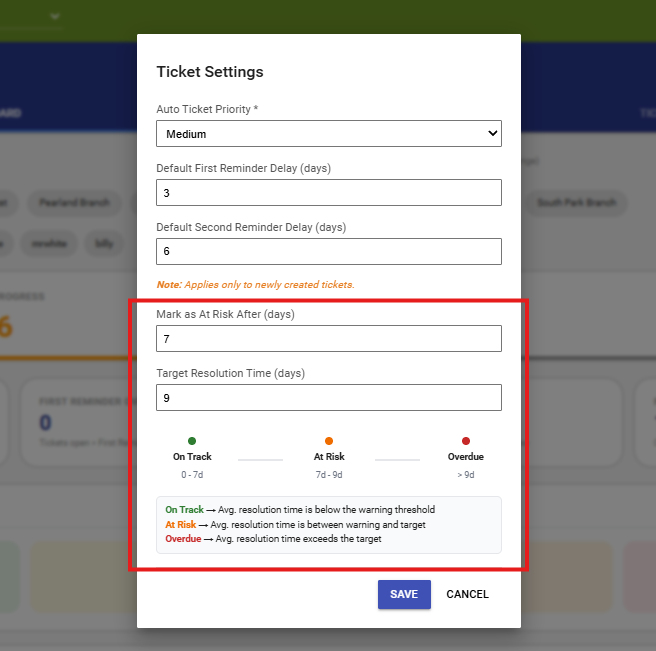
| Mark as At Risk After (days) | The average resolution time above which a department's SLA status changes to At Risk (orange). |
| Target Resolution Time (days) | The average resolution time above which a department's SLA status changes to Overdue (red). |
SLA Thresholds Example:
If Mark as At Risk After is set to 7 days and Target Resolution Time is set to 9 days:
- 0 – 7 days average → On Track (Green)
- 7 – 9 days average → At Risk (Orange)
- Over 9 days average → Overdue (Red)
Note: Ticket Settings can only be modified by users with admin and manager access. Changes to reminder delays apply to newly created tickets only. Changes to SLA thresholds take effect immediately across the dashboard.
Export Options
Download as PDF
- Creates a PDF version of the current dashboard view.
- Captures all active filters, the selected date range, and all visible panels.
- Ideal for sharing performance snapshots with management or keeping dated records.
Use Dashboard Preferences before exporting to ensure only the relevant sections are included in the PDF.